Usage Metrics
The English user guide is currently in beta preview. Most of the documents have been automatically translated from the Japanese version. Should you find any inaccuracies, please reach out to Flatt Security.
The usage metrics view shows Takumi Runner's compute resource usage and estimated costs.
The cost information displayed on this page and in the console is an estimate only, not the exact billing amount. The final billing amount is determined by the values at invoice generation, which take precedence.
Usage Dashboard
Open Runner > Metrics in the Shisho Cloud console to see the usage summary for the current billing period.
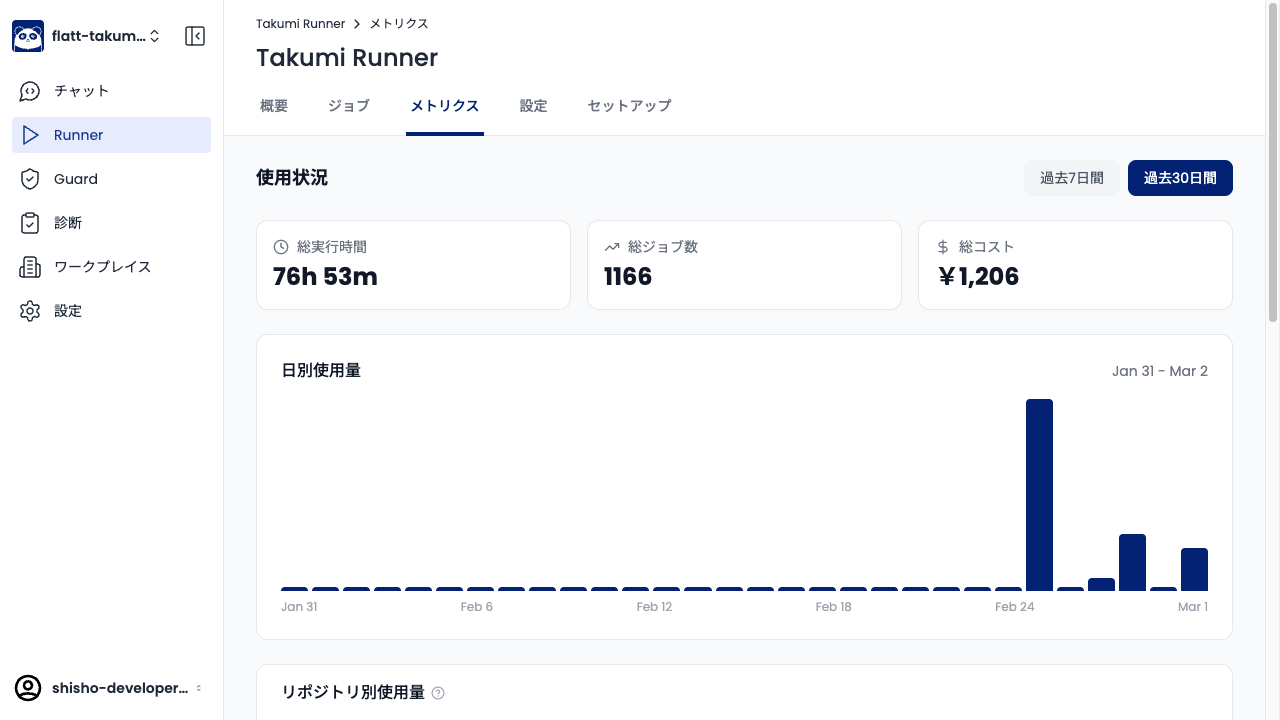
The dashboard shows the following metrics:
| Metric | Description |
|---|---|
| Total Execution Time | Sum of all job execution times within the billing period |
| Total Jobs | Total number of jobs executed within the billing period |
| Total Cost | Estimated cost for the billing period based on current usage |
The display period can be toggled between Last 7 days and Last 30 days. The Daily Usage graph shows the usage trend by day.
Usage Breakdown by Repository
Below the dashboard, a breakdown of usage by repository is displayed. This lets you see how much execution time each repository is consuming.
Usage Calculation
Usage is calculated based on timestamps from GitHub's workflow_job webhook.
- Measurement starts when the job enters
in_progress(started_at) - Measurement ends when the job enters
completed(completed_at) - Billing unit: Per minute (fractions of a minute are rounded up)
- Minimum charge: 1 minute
Queue wait time (from queued to in_progress) is not included in usage.
For details on pricing, see Pricing.