Trace Visualization
The English user guide is currently in beta preview. Most of the documents have been automatically translated from the Japanese version. Should you find any inaccuracies, please reach out to Flatt Security.
Trace data collected by Takumi Runner can be viewed and analyzed in the Shisho Cloud console. This page explains how to read each tab in the job detail view.
Accessing the Job Detail View
Log in to the Shisho Cloud console and select the target job from Runner > Jobs. The job detail view will appear.
The job detail view has six tabs — Overview, Timeline, Execution, Network, File Access, and Query — each providing a different perspective on the trace data.
Overview Tab
The overview tab shows a summary of process executions, network connections, and file accesses that occurred during the job.
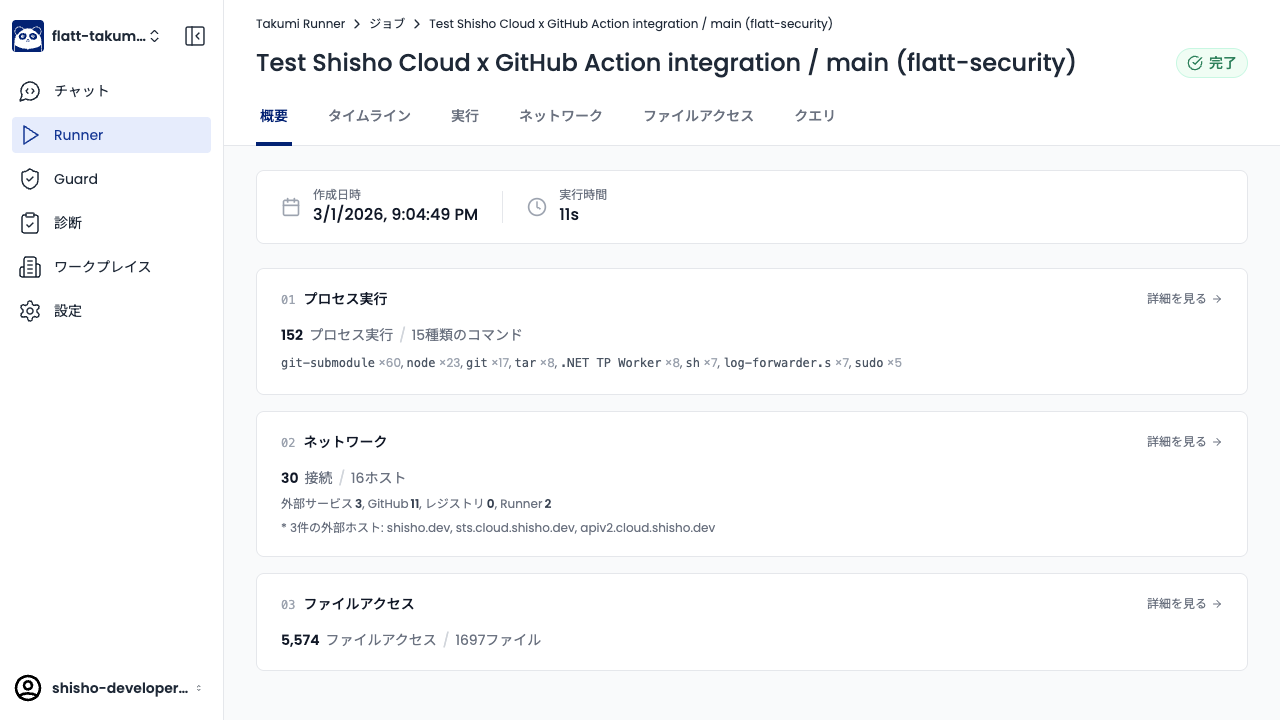
Click the "View details" link in each section to navigate to the corresponding tab.
Timeline Tab
The timeline tab lists each workflow step. Each step shows its type (uses or run) and the number of processes detected within that step.
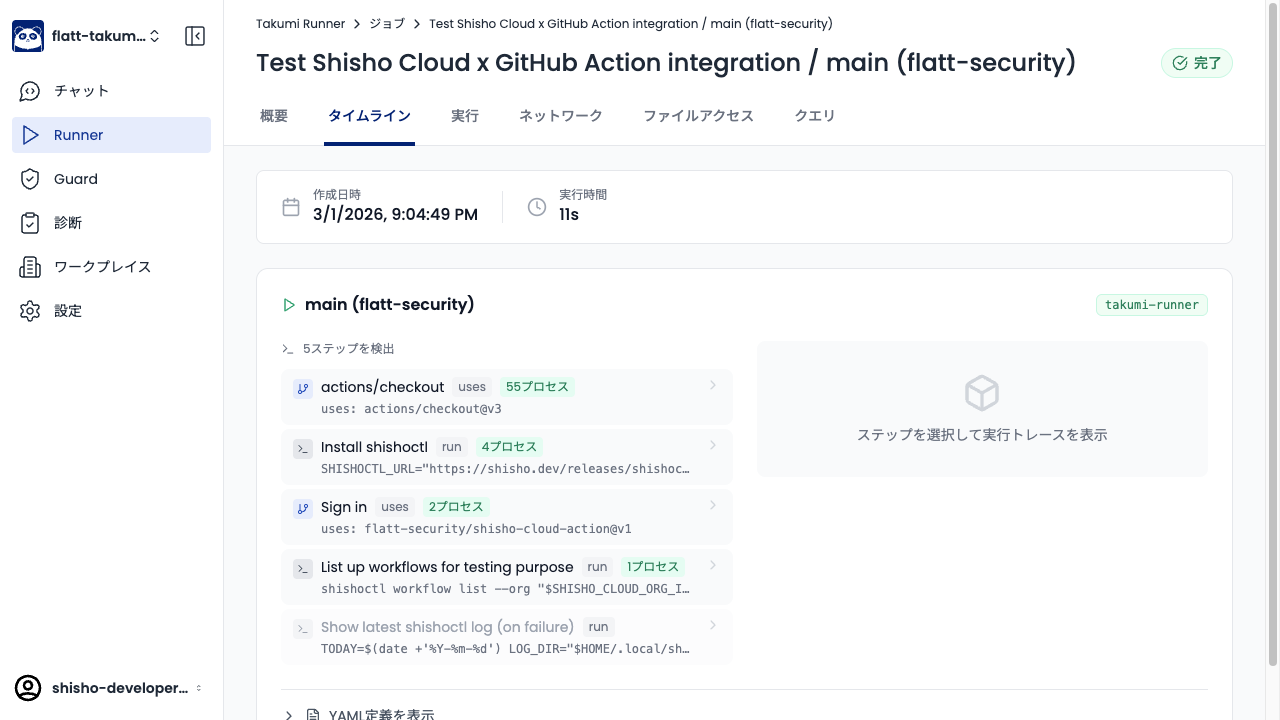
Select a step to view the trace events that occurred during its execution.
Execution Tab
The execution tab displays all processes launched during the job as a chronological process tree. Each process shows its PID, command name, and the executed command line.
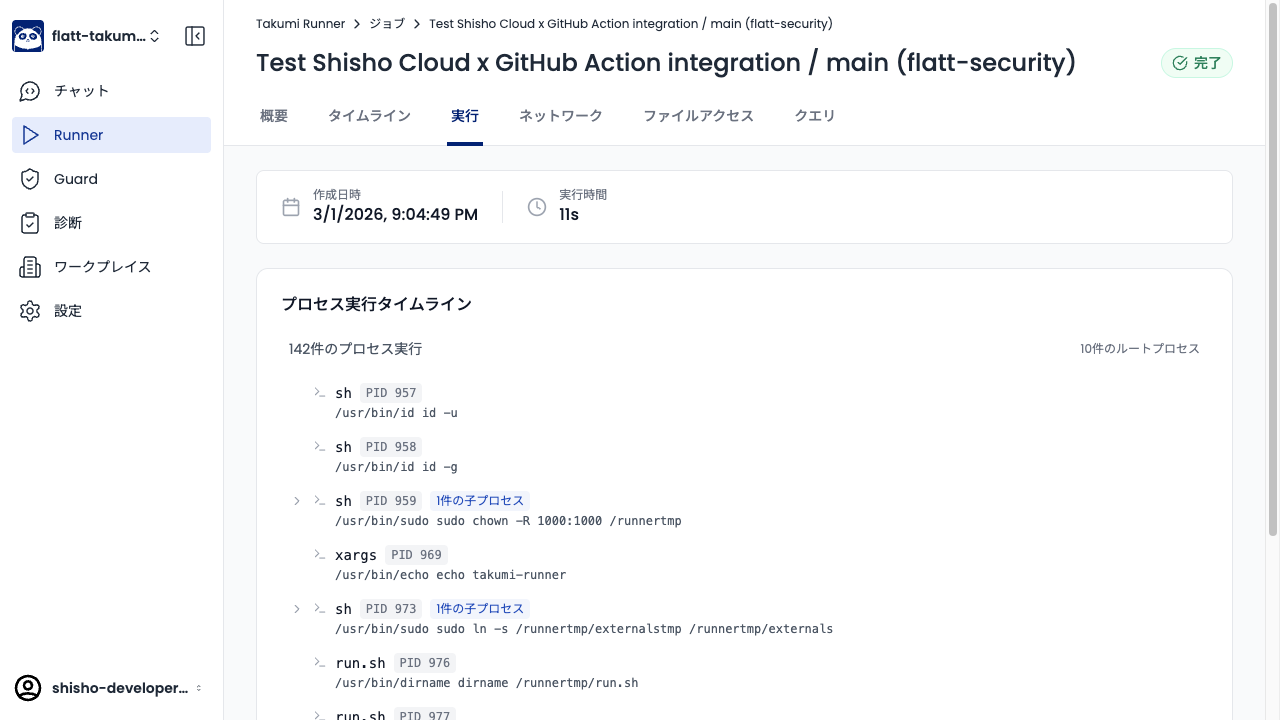
Expand child processes to trace parent-child relationships.
Network Tab
The network tab displays network connections that occurred during the job, categorized by destination type. Destinations are classified into four categories: External Services, GitHub Infrastructure, Package Registries, and Runner Infrastructure.
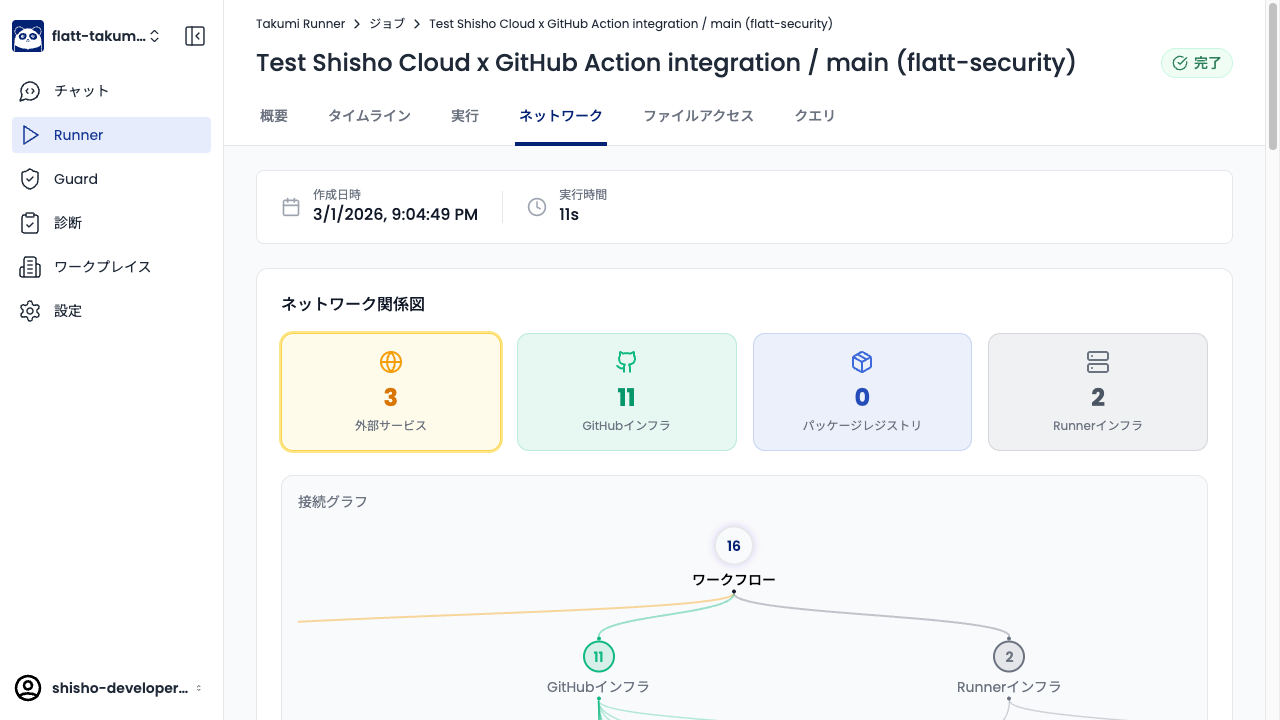
The connection graph provides a graphical view of communication destinations from the workflow. This is useful for identifying suspicious outbound connections.
File Access Tab
The file access tab displays files accessed during the job as a directory tree. Each directory and file shows the number of accesses and the access type (read / write / create / truncate / append).
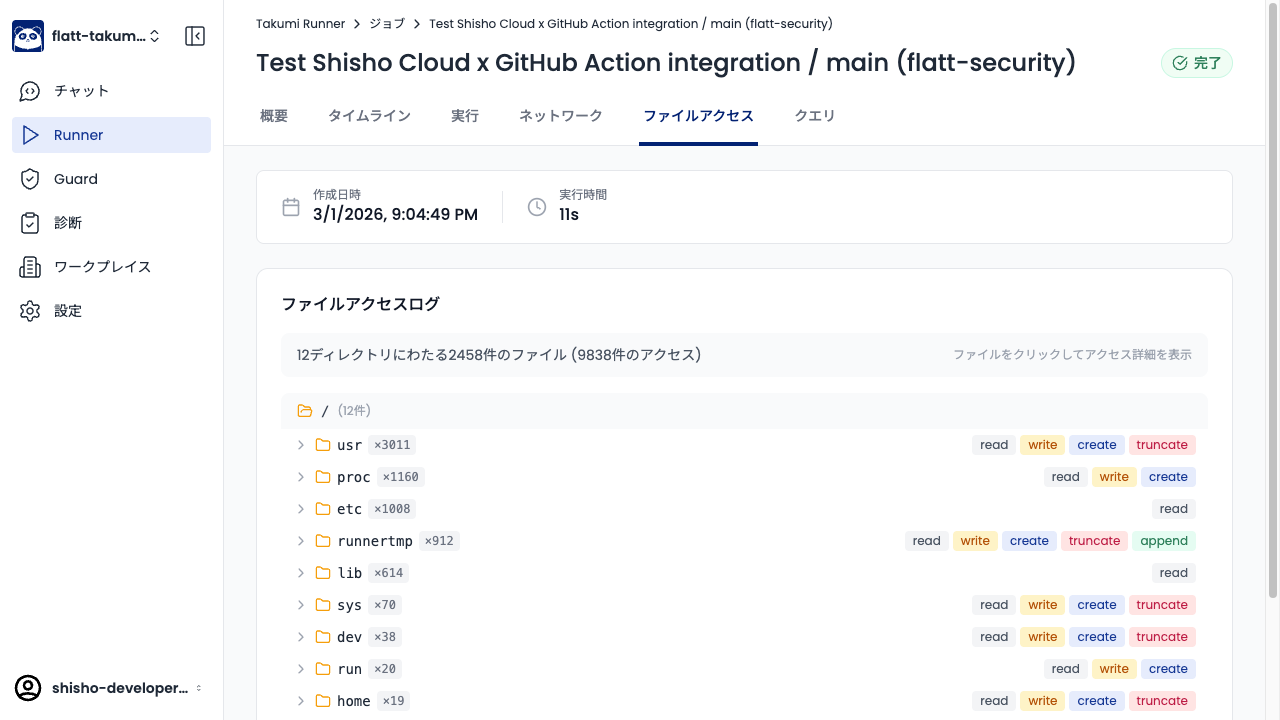
Expand directories and click files to view access details.
Query Tab
The query tab lets you run arbitrary SQL (DuckDB) queries against the trace data. Use this when you need analysis beyond what the predefined tabs provide.
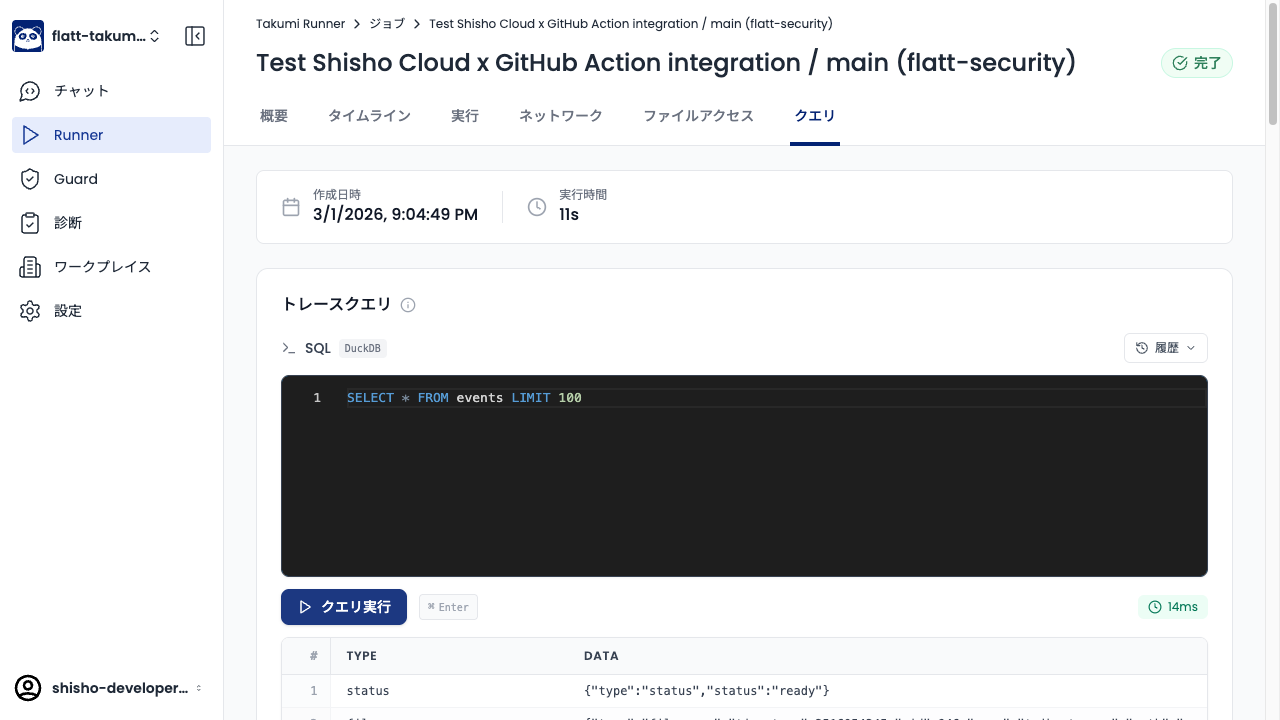
Enter SQL in the query editor and click Run Query to see results. Previously executed queries can be reused from History.
Analysis Tips
Checking for Suspicious Outbound Connections
In the External Services section of the network tab, check for connections to hosts that are not needed for the build. For example, if connections to hosts other than registry.npmjs.org are made during npm install, a malicious package's postinstall script may be sending data externally.
Sensitive File Access
In the file access tab, check whether accesses to paths containing credentials — such as ~/.netrc, ~/.ssh/, or ~/.aws/ — have been recorded. A normal build process typically does not need to access these files.