Trace Collection
The English user guide is currently in beta preview. Most of the documents have been automatically translated from the Japanese version. Should you find any inaccuracies, please reach out to Flatt Security.
Takumi Runner comprehensively captures process, network, and file operations that occur during workflow execution using eBPF. This page explains the types of events captured, the data format, and how to access raw data.
How It Works
Takumi Runner's trace collection is built on Linux kernel eBPF (extended Berkeley Packet Filter) technology. By using eBPF, activity inside the VM is captured at the kernel layer without any modifications to user code running within the workflow.
Captured Events
The Takumi Runner eBPF tracer records the following system call-level events:
| Event Type | Description | Recorded Fields |
|---|---|---|
process_exec | Process execution | PID, command name, file path, arguments |
net_connect | Network connection | PID, destination address, port, protocol |
dns_query | DNS lookup | PID, hostname |
file_open | File open | PID, path, flags |
file_write | File write | PID, path, bytes written |
A single job execution typically generates thousands to tens of thousands of events.
Use Cases
Collected traces can be used for the following types of security analysis:
- Supply chain attack detection: Check whether suspicious outbound connections to unexpected hosts occurred during
npm installorpip install - Incident investigation: Track whether
curlorwgetwas executed during a specific job, or whether files containing credentials such as~/.netrcwere accessed - Baseline analysis: Compare traces from normal builds with traces from anomalous builds to identify differences
Data Format
Trace data is stored in JSONL (newline-delimited JSON) format. Each line corresponds to one event, and each line is an independent JSON object. All events include the common fields type (event type) and timestamp (occurrence time in ISO 8601 format).
The field definitions shown below are reference information based on the current implementation. Fields may be added, changed, or removed without prior notice.
process_exec
Records process execution.
| Field | Type | Description |
|---|---|---|
pid | number | Process ID |
comm | string | Command name |
filename | string | Executable file path |
args | string[] | Command-line arguments |
{
  "type": "process_exec",
  "timestamp": "2025-01-15T10:30:01Z",
  "pid": 1234,
  "comm": "npm",
  "filename": "/usr/bin/npm",
  "args": ["npm", "install"]
}
net_connect
Records network connections.
| Field | Type | Description |
|---|---|---|
pid | number | Process ID |
dst_addr | string | Destination IP address |
dst_port | number | Destination port number |
protocol | string | Protocol (tcp / udp) |
{
  "type": "net_connect",
  "timestamp": "2025-01-15T10:30:02Z",
  "pid": 1235,
  "dst_addr": "104.16.23.35",
  "dst_port": 443,
  "protocol": "tcp"
}
dns_query
Records DNS lookups.
| Field | Type | Description |
|---|---|---|
pid | number | Process ID |
hostname | string | Queried hostname |
{
  "type": "dns_query",
  "timestamp": "2025-01-15T10:30:02Z",
  "pid": 1235,
  "hostname": "registry.npmjs.org"
}
file_open
Records file opens.
| Field | Type | Description |
|---|---|---|
pid | number | Process ID |
path | string | File path |
flags | string | Open flags (e.g. O_RDONLY) |
{
  "type": "file_open",
  "timestamp": "2025-01-15T10:30:03Z",
  "pid": 1235,
  "path": "/home/runner/work/app/package.json",
  "flags": "O_RDONLY"
}
file_write
Records file writes.
| Field | Type | Description |
|---|---|---|
pid | number | Process ID |
path | string | File path |
bytes | number | Bytes written |
{
  "type": "file_write",
  "timestamp": "2025-01-15T10:30:04Z",
  "pid": 1235,
  "path": "/home/runner/work/app/node_modules/.package-lock.json",
  "bytes": 2048
}
Retention Period
Trace data is retained for a minimum of 90 days from the date of collection. Trace data older than 90 days may be deleted.
When a subscription is cancelled, trace data is deleted in accordance with the terms of service.
If you would like to extend the retention period, please contact your account manager. Depending on your contract and usage, we may not be able to accommodate all requests.
Raw Data Access
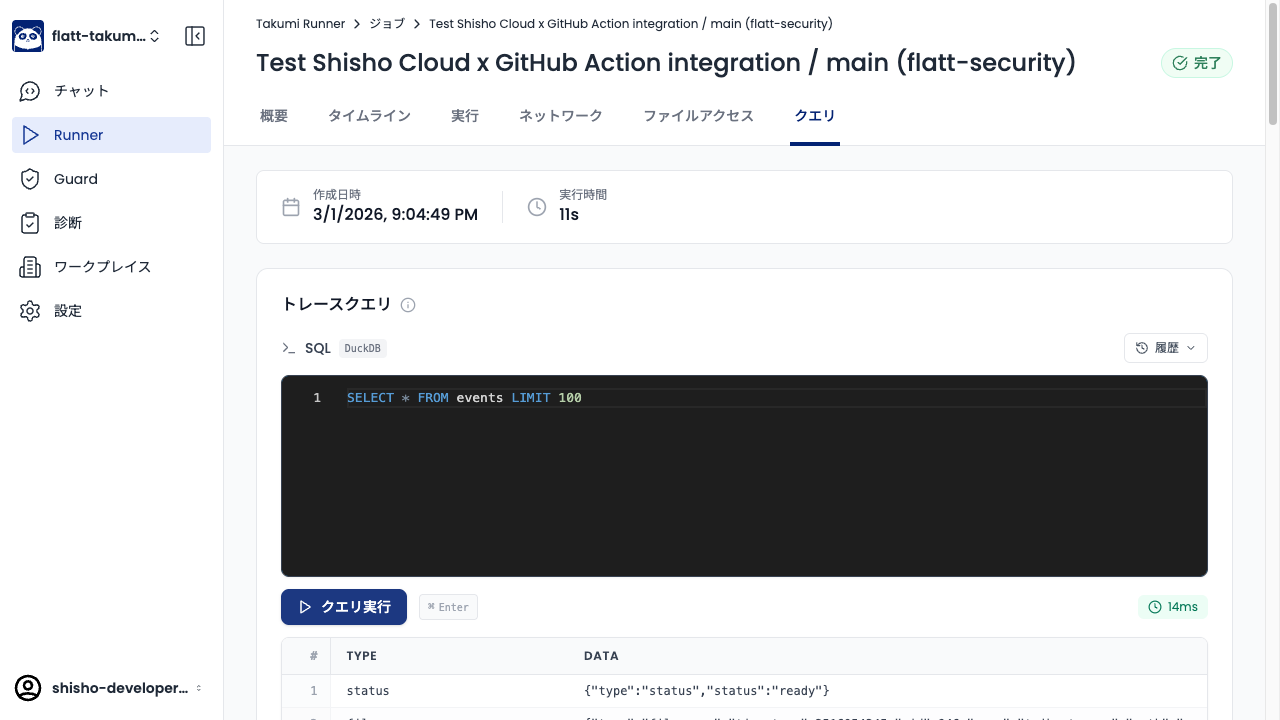
The Query tab in the job detail view of the Shisho Cloud console lets you run arbitrary SQL (DuckDB) queries against the trace data.
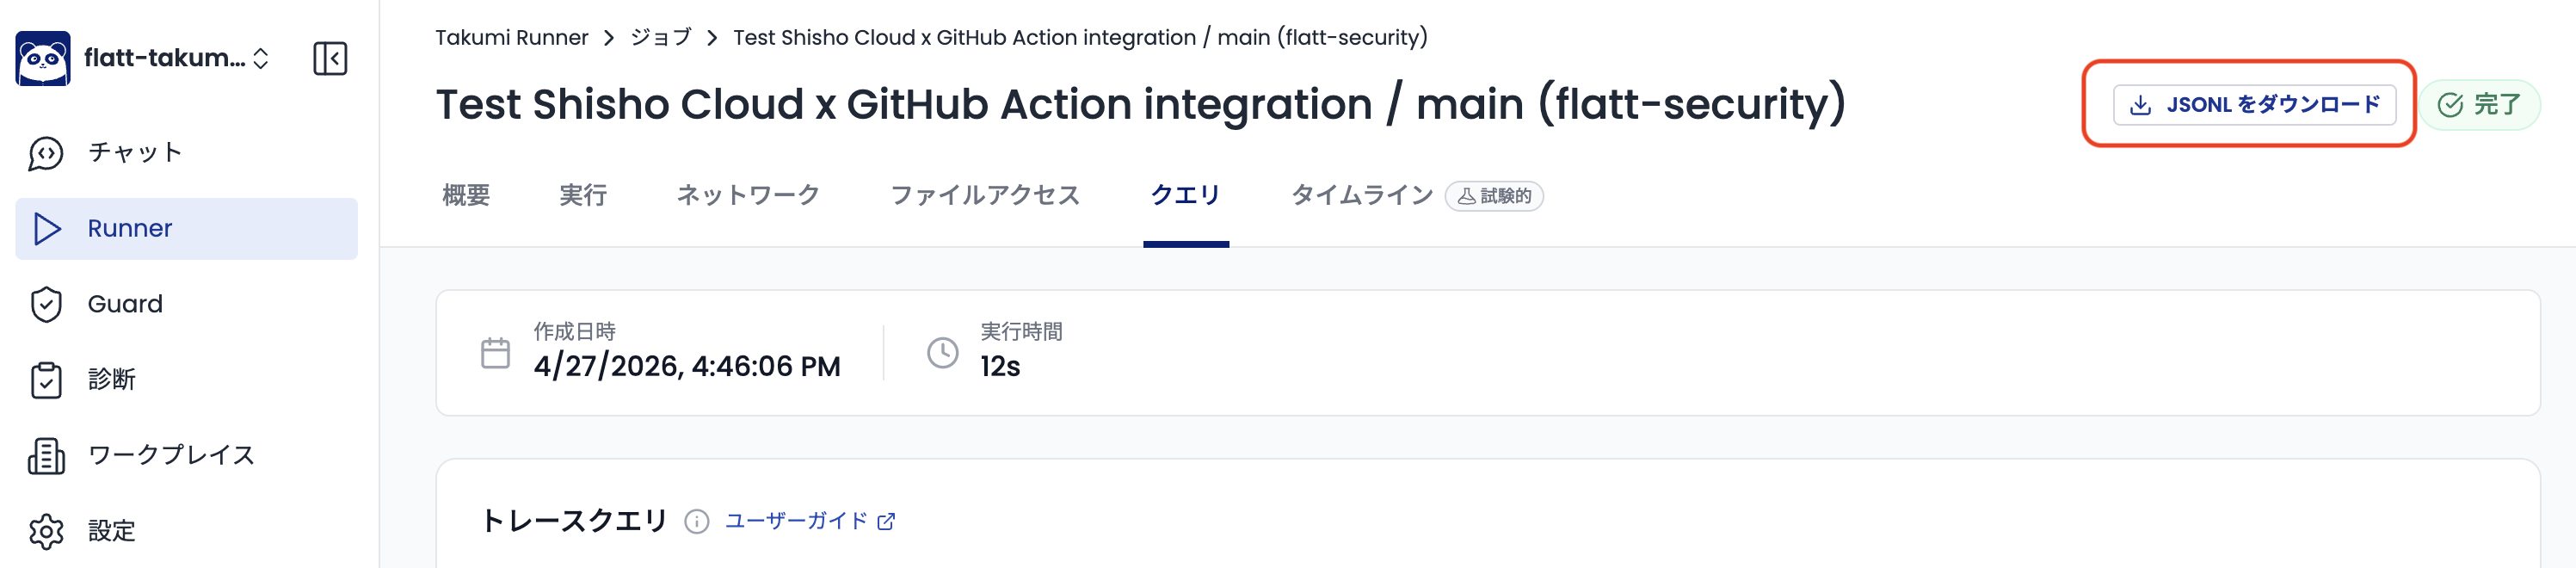
You can also download the trace data for each job execution as a JSONL file. Downloaded raw data can be freely analyzed with your own scripts and tools.
Raw data is plain JSONL. You can process it directly with tools like jq.
cat trace.jsonl | jq 'select(.type == "net_connect")'
Example Queries
The queries below can be copied directly into the Query tab of a job detail view. All trace events live in a single events table, with the event type and payload accessible via json_extract_string(data, '$.type') and the other $.<field> paths.
Detect reads of the Runner.Worker process memory
GitHub Actions' Runner.Worker process holds the job's secret variables (everything exposed via secrets.* and ${{ ... }} expansions) in its own address space. Supply-chain attacks targeting GitHub Actions — most notably the March 2025 tj-actions/changed-files incident — exfiltrate those secrets by reading /proc/<Runner.Worker pid>/mem and /proc/<Runner.Worker pid>/maps from a malicious action running in the same job. Under normal workflow execution, no process should be touching those paths on the Runner.Worker PID, so a hit from this query is a strong indicator of secret exfiltration.
The query first resolves the Runner.Worker PID from the process_exec events, then returns every event that accessed /proc/<pid>/mem or /proc/<pid>/maps for that PID. /proc/self/maps is excluded because processes commonly read their own maps for legitimate reasons (e.g. runtime introspection).
WITH runner_pid AS (
  SELECT json_extract_string(data, '$.pid') AS pid
  FROM events
  WHERE json_extract_string(data, '$.type') == 'process_exec'
    AND json_extract_string(data, '$.filename') LIKE '%Runner.Worker%'
)
SELECT * FROM events
WHERE json_extract_string(data, '$.path') = concat('/proc/', (SELECT pid FROM runner_pid) ,'/mem')
  OR (
    json_extract_string(data, '$.path') = concat('/proc/', (SELECT pid FROM runner_pid) ,'/maps')
    AND json_extract_string(data, '$.path') != '/proc/self/maps'
  )